
One of the most significant concepts in statistics is the p-value. When working on research projects, scientists frequently use this output data to find the statistical significance of 2 data sets. However, how do you calculate the p-value in Google Sheets? This post will teach you everything there’s to know about the subject. By the conclusion of this post, you should be able to calculate the p-value in Google Sheets and confirm your results.
What Exactly Is p-value?
The p-value is used to establish whether or not a hypothesis is valid. When data is not correlated, scientists will pick a value and/or range of values that express the usual, anticipated result. They will know how close they are to these results after calculating the p-value of their data sets. The significance level is the constant that expresses the expected results. Although this number may be chosen depending on past studies, it is commonly set to 0.05. The predicted results are statistically significant if the calculated p-value is significantly less than the significance level. The lower the p-value, the more probable your data demonstrate some correlation.
Simple Summary
We’ll explain everything if you’re unfamiliar with Google Sheets or formulas. Functions are basic formulas that instruct Google Sheets on what data to pull from a set of numbers. For example, the T-Test function will be used to find the p-value (if a set of numbers is statistically significant). The data is statistically significant if the result is less than.05. If it is greater than.05, further data is required.
Using tools like Google Sheets is recommended to eliminate the possibility of getting incorrect results owing to improper calculations. Because the p-value is so important, the developers created a function to calculate it immediately. The part that follows will show you how to achieve it. Here’s how to use the T-Test function to retrieve the results:
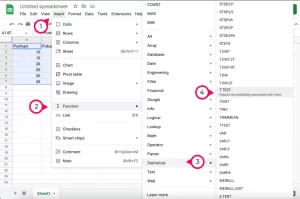
1 – Click the formula input box.
2 – At the top, click Insert. Then, choose Function and Statistical. Then, click to put the T.Test function.
After you’ve added the T-Test function, here’s how to enter the data:
List first set of columns and rows:
1 – Enter the first set as Column Number + Row Number.
2 – After the first set, add a comma.
3 – In our case, it should appear like A2:A7.
Next, list the second set of columns and rows:
1 – Enter the second set as Column Number + Row Number.
2 – After the second set, add a comma.
3 – In our case, it would be B2:B7.
Tell Google about the Distribution Tails:
1 – The number 1 indicates that you are working with the One Distribution tail.
2 – The number 2 indicates that you are working with two distribution tails.
3 – Use a comma after the number 1 or 2.
Next, Input 1, 2, or 3 as the final number:
1 – 1 is the parameter for a paired test.
2 – 2 represents an equal two-sample test.
3 – 3 represents an unequal two-sample test.
4 – Use a comma after 1, 2, or 3.
Let’s test if your data set is higher than or less than 0.5 now that you understand how the function works.
Calculate The p-value In Google Sheets
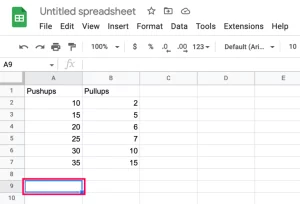
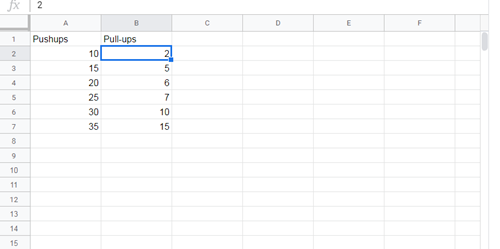
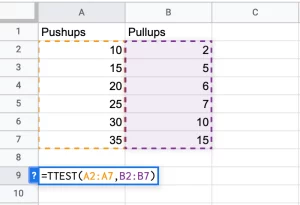
The simplest way to convey this is through a practical example. If you already have a table, apply what you’ve learned in this article. We will begin by collecting two sets of data. We’ll then compare the created data sets to determine their statistical significance. For example, assume we need to analyze data for a personal trainer. We entered the numbers supplied by the personal trainer for their client’s pushup and pull-up progression into Google Spreadsheet.
The table is simple, but it will suffice for this article. Next, we’ll need to use Google Spreadsheet’s T-TEST function to compare these two data sets.
The syntax for this function is: TTEST(array1,array2,tails,type) but you may use syntax T.TEST(array1,array2,tails,type) – Well, both refer to the same function.
Array1 is the first data set. That would be the full Pushups column in our scenario (except for the column name, of course).
Array2 is the second data set containing everything in the Pull-ups column.
Tails reflect the number of tails used in the distribution. There are just two options here:
1 – One-tailed distribution
2 – Two-tailed distribution
Type is an integer value that can be one (paired T-TEST), two (two-sampled equal variance T-TEST), or three (two-sample unequal variance T-Test).
To work through the example p-test, we will follow the following steps:
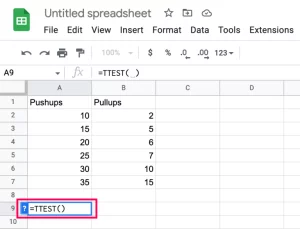
1 – Call a column TTEST and display the results of this function in the column next to it.
2 – Select the empty column where you wish the p-values to be displayed, and then enter the necessary formula.
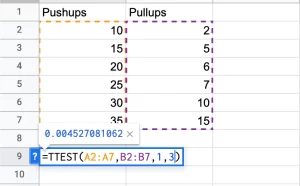
3 – Input the following formula: =TTEST(A2:A7,B2:B7,1,3). As you can see, A2:A7 denotes the start and end of our first column. Hold your mouse in the first place (A2) and drag it to bottom of your column, and Google Sheets will change your formula automatically.
4 – Insert a comma into your formula and repeat for the second column.
Notice The filled columns have been highlighted.
5 – Fill in the tails & type arguments (separated by commas), and press Enter.
Note: See the preceding section for further information.
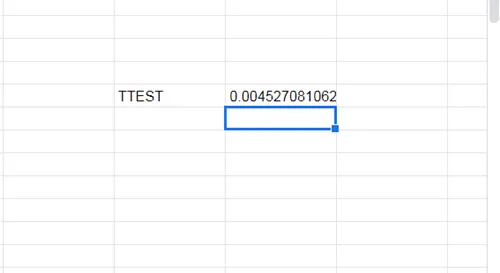
Your result should be displayed in the column where you typed the formula.
Common Error Messages
If you typed your TTEST formula incorrectly, you most likely saw one of the following error messages:
1 – #N/A – displayed if your 2 data sets have different lengths.
2 – #NUM – displayed if the entered tails argument is not equal to 1 or 2. It may also be displayed if the type argument differs from 1, 2, or 3.
3 – #VALUE! – displayed if you’ve entered non-numeric values for tails and/or type arguments.
Consider The Following:
Calculate Data Has Never Been Easier With Google Sheets
You should now have another Google Sheets function in your arsenal. Even if you aren’t a statistician, learning about the capabilities and features of this online tool will help you improve your data analysis skills. Do you have another way of calculating the p-value that you use? Please share your thoughts in the comments section below.